
Table of Contents (click to expand)
The aim of finding correlation is to find out the degree of closeness of scattered points to a straight line (linear association). This helps to indicate a relationship between two random events. Correlation may not always imply causation, as there may be a third variable that is causing both of the events.
Have you ever come across weird statistics about two events that are seemingly unrelated? For example, if one were asked to predict the sales of Air Conditioner (AC) units based solely on the knowledge of sales of frozen yogurts, the prediction may very well seem ridiculous. ACs and yogurts are, after all, two very different consumer goods produced by unrelated industries. One may argue that yogurt has as much in common with an AC as planet Earth has with Haley’s comet.
Or consider this, for example: In the first half of 2020, media was abuzz with this study, correlating temperature with COVID-19 transmission. Yet, this second study, carried out on data available from the same time interval, which concluded otherwise, did not receive similar attention. Why is that so? Does it mean that finding correlations is futile?
No.
First, let’s try to understand what correlation is before proceeding to find its merits. Then, we’ll move on to causation.
Finding Meaning From Random Data: Exploratory Analysis
An event is any occurrence that is observable (can be stored as a number). For example, the sales of AC units, marks obtained by students in a class, goals scored by a player, etc. These random events from real life are stored in the form of data; by using this data, sellers, teachers and coaches may be able to make some conclusions.
When many data points (numerical values) are available for a random event, the event is called a random variable (Random because the values they take cannot be predicted before the occurrence and variable because the values keep changing at each new occurrence).
When two random variables are taken into consideration, it might be possible that there exists some relationship between them that would help understand the events better and make accurate predictions about the future outcome of those particular events. This comes in quite handy when limited initial data is present.
Two basic statistical concepts must be introduced that will help us understand correlation better.
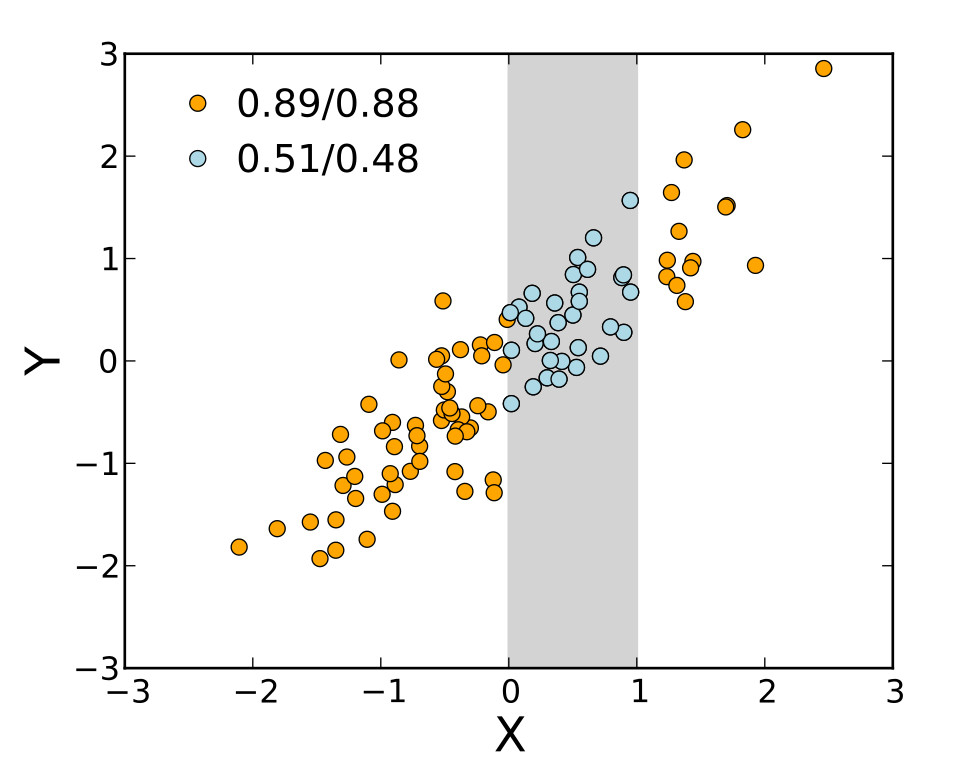
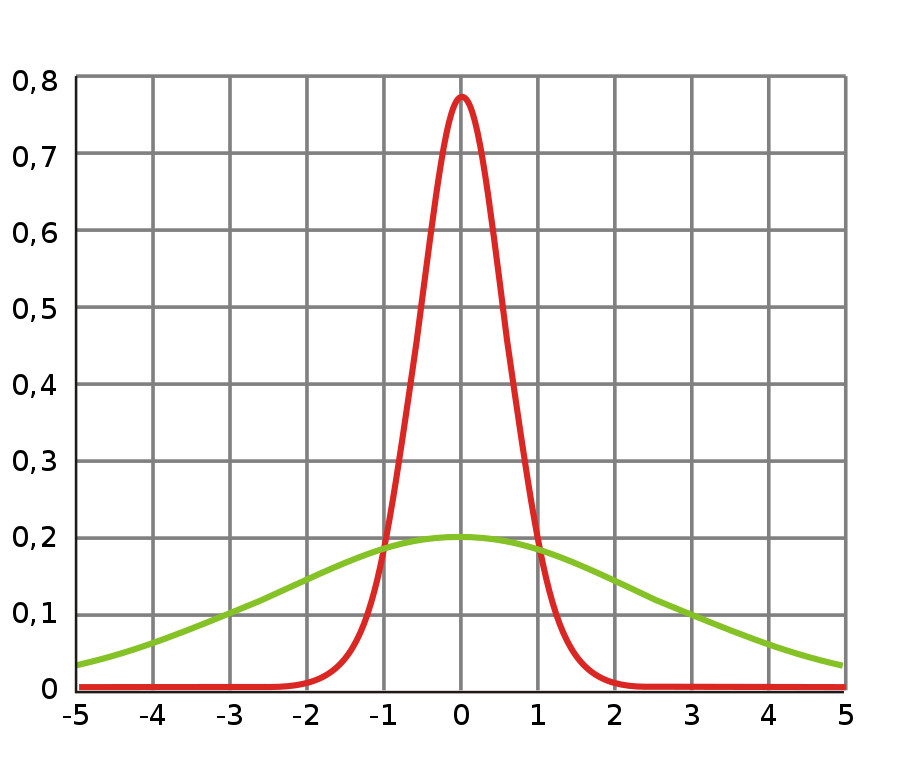
The first is variance. Given a random variable X with n data points, variance describes the average difference of each data point from the mean of X. When plotted on a graph, variance indicates the dispersion of values. A more dispersed dataset would have a higher variance than a closely spaced dataset.
The second is covariance. Given two random variables, X and Y, a change in the values of one variable may or may not be associated with a change in the values of the other variable. Covariance assigns a numerical value to this tendency of change in the values.
Correlation
Correlation is a mathematical tool used to indicate a relationship between two random events. The aim is to find out the degree of closeness of scattered points to a straight line (linear association). Given n data points about two events X and Y, correlation, r, is given by:
 where,
cov(X, Y) = covariance between X and Y
![]()
From the mathematical definition of correlation, ![]() always.
always.
The following cases arise:
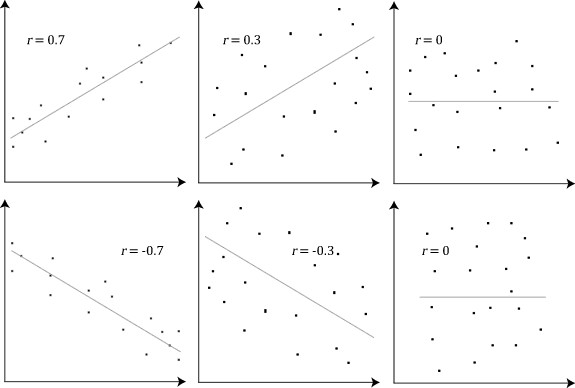
If r=1, then the data points lie on a straight line and there is no scattering. We say that X is linearly correlated to Y. This means that a change in X results in a proportional change in Y, which on a graph is seen as a straight line with a positive slope.
If r=-1, then the data points also lie on a straight line and there is no scattering. X is still linearly correlated to Y. However, a change in X results in an inverse proportional change in Y, which on a graph is shown as a straight line with a negative slope.
If -1 < r < 0, then the points remain scattered around a best-fit approximation line with a negative slope.
If 0 < r < 1, then the points remain scattered around a best-fit approximation line with a positive slope.
Also Read: What Is An Independent Variable?
Correlation May Not Imply Causation
Having studied the basics of correlation, let’s dive deeper into the interpretation of correlation. Often, quite erroneously, correlation between two random variables X and Y is interpreted as causation, i.e., X causes Y. Take the example of AC sales (X) and frozen yogurts sold (Y). If a positive correlation is found (say, r = 0.8), would that imply that X caused Y or vice-versa? No. What it implies is that there’s probably some other factor (Z), which is common to X and Y. What could Z be?
What random variable could cause a positive change in AC sales and Yogurt sales? That random variable could probably be temperature.
Think about this. Frozen yogurt is a dessert, which has a much higher probability of being consumed during the summer than during other seasons. An increase in temperatures could very well cause more people to buy such desserts just to cool themselves down. Similarly, ACs regulate room temperature, which is very useful in the summer season. Increasing temperatures may force even the most hardened individuals to buy an AC unit. Thus, increasing temperatures may lead to an increase in AC sales, or in simpler terms, Z causes both X and Y.

Here, the relation between (Z, X) and (Z, Y) is a causal relationship. We can predict that an increase in X would be associated with an increase in Y. We can make this prediction due to our knowledge of the common variable Z (temperature). What correlation did, in this instance, was help us find the causal factor behind those two events.
Also Read: What Is Synchronicity?
How well do you understand the article above!

References (click to expand)
- Thangariyal, S., Rastogi, A., Tomar, A., Bhadoria, A., & Baweja, S. (2020, June 16). Impact Of Temperature and Sunshine Duration on Daily New Cases and Death due to COVID-19. []. Cold Spring Harbor Laboratory.
- Jamil, T., Alam, I., Gojobori, T., & Duarte, C. M. (2020, March 31). No Evidence for Temperature-Dependence of the COVID-19 Epidemic. []. Cold Spring Harbor Laboratory.
- The Correlation Coefficient (r) - SPH. Boston University
- D Joyce. Covariance and Correlation Math 217 Probability and Statistics. Clark University
- Textbooks PDF (I-XII) - NCERT. The National Council of Educational Research and Training