Table of Contents (click to expand)
Astronomical spectroscopy involves converting light from celestial bodies into a digital spectrum. The digital spectrum is then compared to the spectral data of different chemical substances known to mankind. The analysis helps scientists determine the chemistry of the celestial source that emitted this light.
In September of 2020, another planet in our solar system stole the spotlight from Mars, drawing attention from both the scientific community and mainstream media. This was put in motion after a gripping report by an International Research team that announced: “Phosphine gas found in the atmosphere of Venus”. The report, published in nature astronomy, gave rise to debate and speculation about signs of life present on the planet, primarily because anaerobic ecosystems produce phosphine.

However, apart from the debate about whether phosphine indicates the presence of alien life or not, this story gives rise to a few other elemental questions. Namely, how did they understand the chemistry of Venus from here on Earth?
Fortunately for us, the light entering our telescopes from a heavenly body not only creates great images, but also carries information about what those celestial bodies are made of. The tool that helps us process this information is astronomical spectroscopy.
Early Astronomy
Humanity’s curiosity about the cosmos stretches back beyond recorded history. Early humans and their cave paintings give us some insight into their interest in astronomy. People have spent many moons making astronomical observations, such as predicting eclipses with mathematics and identifying constellations with their naked eye. Quite simply, the stars have always fascinated us.
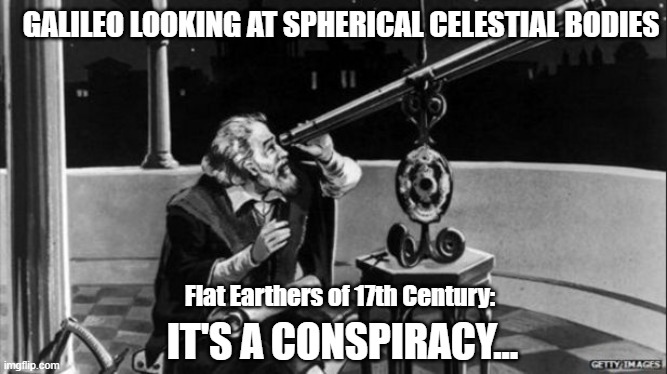
Using our naked eye to observe the heavens was the only option until the 1600s, when Galileo started using his spyglass (early telescope) for astronomy. Hans Lippershay, a Dutch optical glass maker, invented the refractor telescope, while Galileo was the first to use it for astronomy. All of a sudden, he could see things like craters on the moon, dark spots on the sun, Saturn’s rings, and Jupiter’s moons. Little did he know that someday, mankind would be able to analyze the chemistry of the cosmos from the comfort of our cozy and warm(ing) planet.
In 1814, Joseph von Fraunhofer a Munich-based optician, came up with the spectroscope, a telescope modified with a theodolite (a precision optical instrument). He became the first astronomical spectroscopist to study the spectra obtained from different celestial bodies, such as the moon, sun, other planets, and stars.
However, the first people to co-relate spectral lines with the chemistry of an object were Robert Kirchoff and Robert Bunsen (also known for Kirchoff’s laws and the Bunsen burner.) They were the founding fathers of modern spectral analysis or spectroscopy. Not only did they identify the predictive nature of spectra, but they also discovered two new elements—Rubidium and Cesium—using their technique.
Fast-forward to the present day, where we combine the powers of telescopes and spectroscopy to analyze the chemical compositions of celestial objects even beyond our Milky Way galaxy.
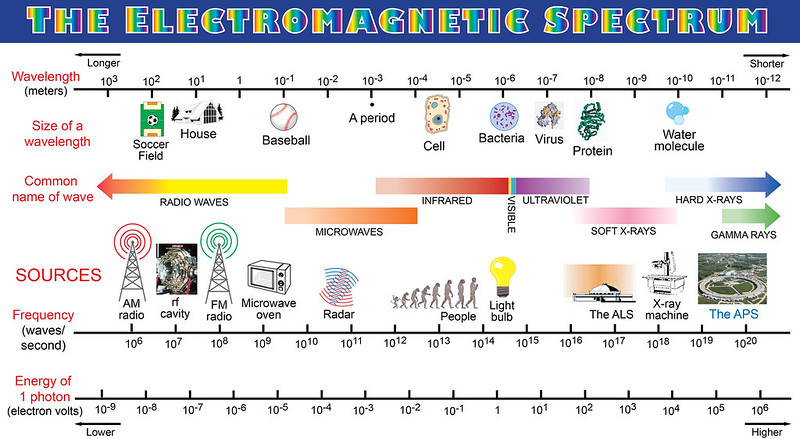
Before we get into spectroscopy, perhaps we need a quick refresher about the properties of light. Light is a form of energy that travels as a wave. It is a form of electromagnetic radiation (EM waves) that ranges from radio waves to gamma rays, of which we can only see the middle section (the small visible range). These radiation types are segregated based on their wavelengths or frequencies.
Now, on to the spectra and spectroscopy!
Also Read: Most Important Astronomical Discoveries To Date
What Is A Spectrum?
A spectrum (plural spectra) is a pattern created when light (EM waves) interacts with matter (for example, we see a rainbow when sunlight interacts with raindrops). A spectrum is distinctive and depends on the type of EM waves and the property of matter interacting with it. Now, if we know information about the spectra and the type of light, we can easily deduce the type of matter with which the light has interacted. This is what spectroscopy allows us to do—analyze the spectra and trace backwards to determine what created it.
What Creates Spectra?
Though not evident to our naked eye, the whole world is dancing in its own rhythm at an atomic level. Everything we know is made of atoms and atoms have electrons that constantly vibrate like a wave (being a quantum object), and when light hits them they interact in unique ways.
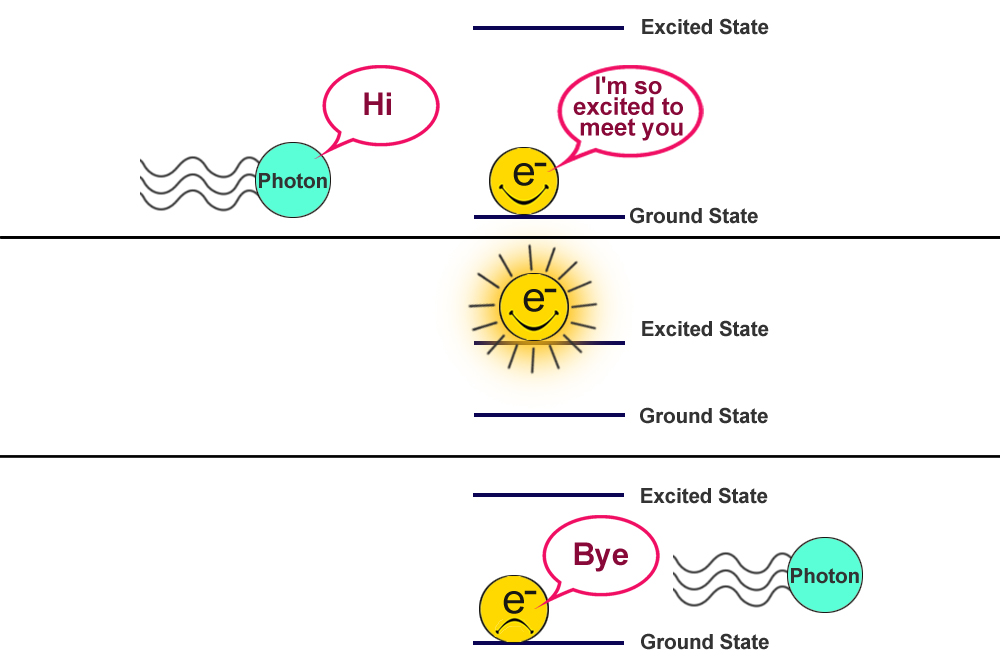
The electrons in an un-agitated atom like to hang around their ground state. When external energy in the form of light (or heat) hits them, they absorb it to reach an excited state. Yet, they always tend to return to their ground state; to do this, they emit the energy that they absorbed in the first place. This absorption and emission process gives rise to a bunch of spectrum or spectra.
What Is Spectroscopy?
This energy absorbed or emitted during the excitation and relaxation process is unique to a substance’s molecular composition. For example, the frequencies of light absorbed by electrons of a sodium atom would be completely different from the frequencies absorbed by carbon. Similarly, light emitted by oxygen would be completely different from that of phosphine.


Chemical fingerprints or patterns are formed due to the absorption or emission of light at discrete frequencies, and the study of those light patterns is formally called spectroscopy.
Now, coming to astronomical spectroscopy. The light from the source (celestial bodies) hits the telescopes, and through a small opening enters the spectrograph attached to it. Inside the spectrograph is a collimating mirror (a parabolic mirror that converts all the light entering the instrument into parallel rays). This light hits a mirror with diffraction grating (fine regular scratches on the glass surface).
The grating acts like a person who loves to separate M&Ms based on color. It separates the different components of light and assigns them individual lanes based on their wavelength, ultimately creating a spectrum on another mirror. The spectrum formed on the mirror is then detected by a charged coupled device (a photosensitive surface) and converted into a digital spectrum.
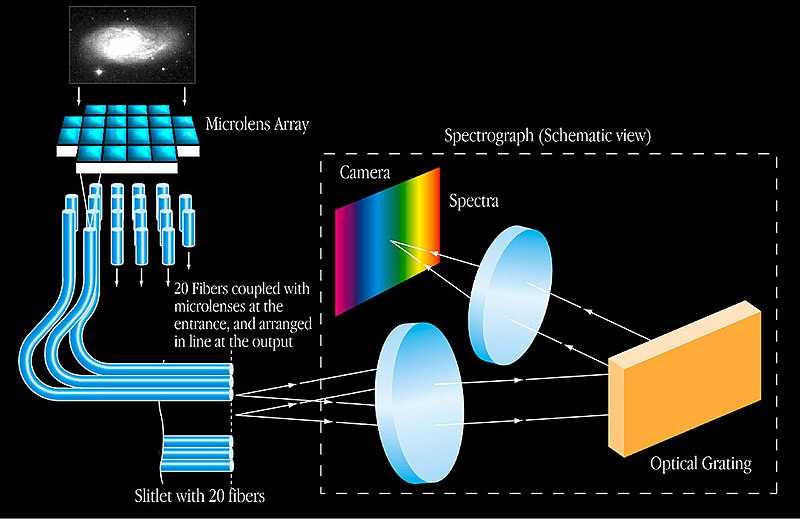
The digital spectrum is then compared to the spectral data of different chemical substances known to mankind. The analysis helps scientists determine the chemistry of the celestial source that emitted this light.
The spectral data not only provides information about the chemical composition of the objects in space, but also their type, surroundings, and the kind of motion they exhibit.
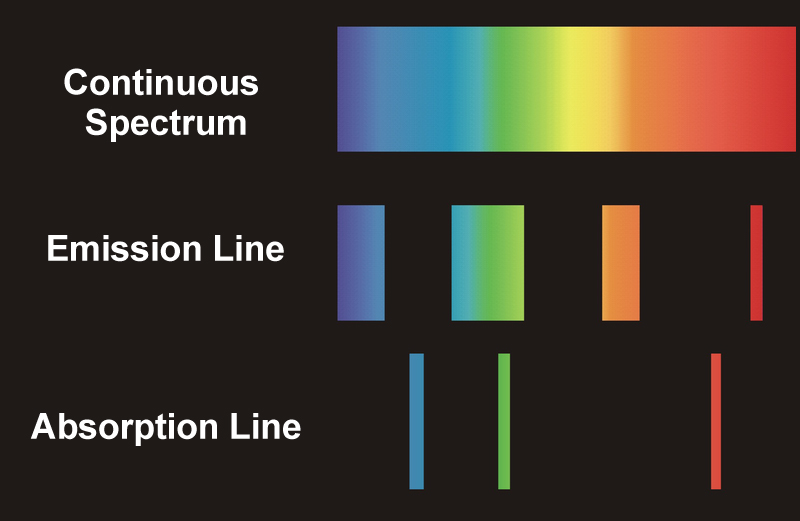
If the light is being received directly from a hot source, like a star, planet, or nebulae, we see a continuous spectrum. Most of the planets or stars are surrounded by an atmosphere of gases that are generally cooler than the source emitting the light. The cooler gases absorb some of the frequencies of light radiated by the source, so when the light from that source reaches us through the clouds, the absorbed frequencies appear darker on the generated spectrum. These types of spectra are known as absorption or dark line spectra.
On the other hand, if we try to observe the surrounding gases instead of the source, we see those absorbed frequencies being emitted back as bright lines in the spectrum generated. These types of spectra are known as emission or bright-line spectra.
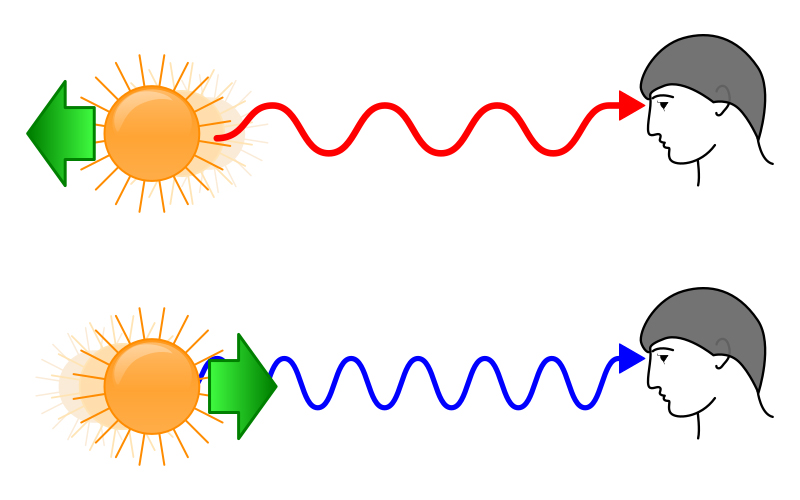
We have all heard that the universe is constantly expanding. This implies that some objects are moving away from us, while others are coming closer. This motion can be determined by studying the shifts seen in the spectrum. For example, scientists have resolved what the emission spectral lines of hydrogen would look like from a star that is considered stationary relative to Earth. This spectrum is then compared to the H emission spectra of other celestial objects.
If the object is moving away from us, the spectral lines of the H spectrum would appear to have shifted towards the redder region or the longer wavelength region of the spectrum. This is known as a red-shift. If the body is moving closer to us, the lines would appear to have shifted towards the shorter wavelength or the bluer end of the spectrum. This is known as the blue shift. This observable shift in the wavelengths is called Doppler Shift.
The Spectral lines are like gifts that keep on giving. Apart from what has been discussed above, they also provide us with information about the density, temperature, and magnetic fields of different heavenly bodies.
Also Read: What Is Blackbody Radiation?
Conclusion
Mankind has always been fascinated by the night sky. We have gone from staring in wonder at twinkling stars in the night sky with our naked eye to having a 1.5-billion pixel Hubble telescope image of the Andromeda galaxy that is 2.5 million-light years away from us. Every day, we go deeper into space, trying to understand what the universe is made up and unlock the secrets hidden in the silence outside our planet. As Carl Sagan once said, “Somewhere, something incredible is waiting to be known.”
Also Read: Why Is Space Black?

How well do you understand the article above!

References (click to expand)
- Hunt, R. (2011). History of Spectroscopy - an essay. Unpublished.
- How do we know the composition of stars?. Rochester Institute of Technology
- Spectroscopy - ESO.org. The European Organisation for Astronomical Research in the Southern Hemisphere
- Joseph Von Fraunhofer. The University of Arizona
- Spectra and What They Can Tell Us. The National Aeronautics and Space Administration
- What Do Spectra Tell Us? - Imagine the Universe!. The National Aeronautics and Space Administration
