
Table of Contents (click to expand)
Climate change is the long-term changes in the weather patterns in a region. Another term interchanged with climate change is global warming. Global warming is the rise in Earth’s temperature which persists for a decade or longer. There could be several causes for climate change.
The climate change that we face today is the effect of the rising concentration of carbon dioxide. The primary source of carbon dioxide is the burning of fossil fuels. Scientists have observed several long-term changes in weather patterns since the mid-late 19th century.
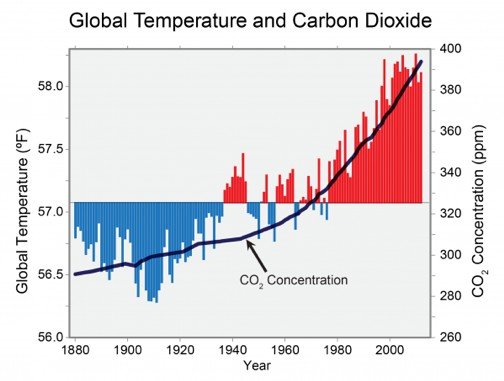
These changes are collectively known as climate change. Scientists measure the level of carbon dioxide in parts per million, i.e., the number of moles of carbon dioxide per million moles of air and global temperature in degrees Fahrenheit or degrees Celsius. As shown in Fig 1, the increase in global temperature is following the atmospheric carbon dioxide concentration.
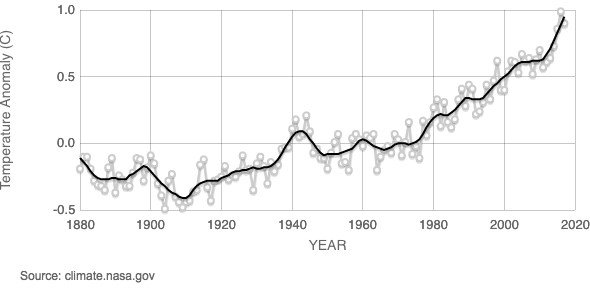
The rise in average temperature measured as a temperature anomaly relative to 1951-1980 average temperatures shows that the temperature in 2016 was almost a degree centigrade higher than the average.
NASA brings out a scientific visualization of the time series data on different weather variables. The following video shows a five-year variation of global surface temperatures
Effects And Physical Evidence Of Climate Change
The rise in global temperature is changing several other weather patterns. The increase in temperatures is causing warming of oceans, melting of ice mass and an increase in evaporation. These effects are having several physical impacts such as sea level rise and increased variability in weather patterns and extreme weather events. The adverse impact of these physical changes due to global warming is now becoming visible on the biological system and human systems. The higher temperature is causing seawater to expand resulting in sea level rise. It is also causing several harmful impacts on the marine ecosystem.
- Ocean warming: The oceans absorb almost 90% of the excess heat from the surrounding air making it warmer. Although most of the heat is absorbed in the surface, as the rate of warming is increasing the heat is reaching deeper waters.
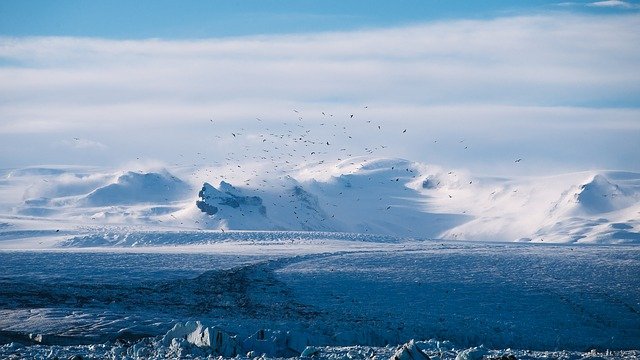
- Changes in snow, ice, and frozen ground: Increase in temperature directly impacts the snow, river and lake ice, sea ice, glaciers, and ice caps, ice shelves and ice sheets, and frozen ground. The rising surface temperature is causing a decline in ice mass. Ice mass measurement by NASA’s satellite shows that the Antarctica and Greenland mass is declining at an unprecedented rate. Glaciers are also retreating almost everywhere around the world including the Alps, Himalayas, Andes, Rockies, Alaska, and Africa.
- Sea level rise: Sea level rise is caused primarily by water from melting ice sheets and glaciers and the expansion of seawater as it warms. Satellite level observations indicate that the sea height is increasing at a fast rate and will continue to rise at a quicker pace. The rise in sea levels has adverse impacts on the population living in coastal areas. It also plays a role in flooding and an increase in storms.
- Changes in weather patterns and extreme weather events: Changing climate leads to changes in the frequency, intensity, spatial extent, duration, and timing of weather and climate extremes. Weather and climate extremes are events that occur when the weather or climate variable is above or below a threshold value of the variable. Some of the changes in weather patterns include an increase in the number of warm days and nights and a decrease in cold days and nights and an increase in the frequency and intensity of daily temperature extremes. Some of the extreme weather events include floods, droughts, hurricanes, and heatwaves.
Also Read: Climate Change And Agriculture: Which Crops Are Likely To Be Affected The Most?
What Is Causing Climate Change?
The rising concentration of greenhouse gases in the earth’s atmosphere is causing climate change. The sun emits solar radiations which are shortwave radiations such as ultra-violet radiations and visible light. The earth’s surface absorbs some of the solar radiation and reflects the rest as longwave radiation, i.e., infrared radiations. Some of the reflected radiation escapes the earth’s surface, and some are absorbed by gases such as carbon dioxide and methane. These gases act similar to a greenhouse and hence are called greenhouse gases.
The most significant greenhouse gas is carbon dioxide. Other greenhouse gases are methane, nitrous oxide, fluorinated gases – hydrofluorocarbons, perfluorocarbons, etc. The effect of these gases on climate change depends on the amount of gas and their global warming potential. The global warming potential (GWP) is calculated to reflect how long a gas remains in the atmosphere, on average, and how strongly it absorbs energy. Gases with a higher GWP absorb more heat and thus contribute more to warming Earth. The concentration of carbon dioxide is higher than any other gas and is the major contributor to the warming of the planet.
Natural causes and human activities both emit greenhouse gases. There is a scientific consensus that human-induced greenhouse gas emissions have caused the observed temperature anomaly. The increase in economic activities since the industrial revolution has resulted in increasing amounts of carbon dioxide emissions. These emissions are higher than the amount that can be captured by the earth’s natural carbon cycle. The primary source of human-induced greenhouse gas emissions is the burning of fossil fuels, agriculture, and change in land use patterns.
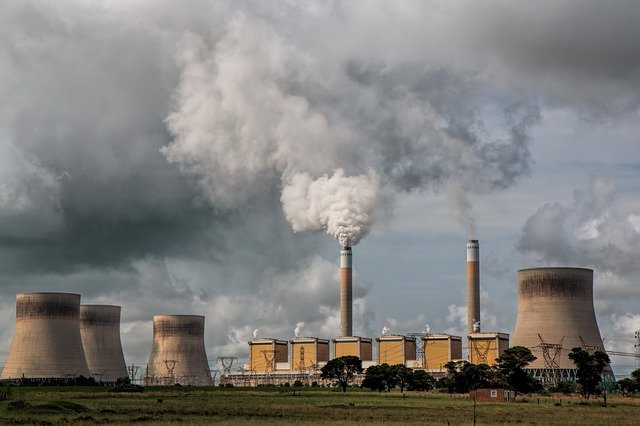
- Burning of fossil fuels: The burning of fossil fuels like coal and oil has increased the concentration of atmospheric carbon dioxide. The contribution of fossil fuels in the greenhouse gas emissions is the largest in the range of 70- 80% of the total emissions.
- Agriculture: greenhouse gas emissions from agriculture comes from livestock such as cows, agricultural soils, and rice production and is in the range of 10-15% of the total emissions.
- Changes in land use patterns: Clearing of forests for cultivation, industry, and other human activities have increased concentrations of greenhouse gases. The share of changes in land use patterns in the total emissions is in the range of 5-10% of the total emissions.
Also Read: What If We Did Not Have Greenhouse Gases?
Conclusion
To summarise, the changes in weather patterns that persist over a decade or more are defined as climate change. The rising concentration of carbon dioxide in the atmosphere is causing an increase in the average temperature of Earth’s surface. This phenomenon is also known as global warming. Global warming is disturbing the natural cycles and causing several long-term changes in local and global climate. The primary source of carbon dioxide emission is the burning of fossil fuels for various economic activities. The other causes of climate change include agriculture and changes in land use patterns.
How well do you understand the article above!

References (click to expand)
- Vital Signs of the Planet - Evidence | Facts – Climate Change. The National Aeronautics and Space Administration
- IPCC — Intergovernmental Panel on Climate Change. The Intergovernmental Panel on Climate Change
- Sources of Greenhouse Gas Emissions | US EPA. The Environmental Protection Agency
- How does climate change affect precipitation?. The National Aeronautics and Space Administration